Profiler(性能分析器)
显示原文
As the complexity of the application increases, performance issues such as low FPS and frequent cache misses causing lag may arise. LVGL has internally set up some hooks for performance measurement to help developers analyze and locate performance issues.
随着应用程序的复杂性增加,可能会出现诸如低 FPS 和频繁缓存未命中导致卡顿等性能问题。 LVGL 内部设置了一些性能测量的钩子,以帮助开发人员分析和定位性能问题。
Introduction(介绍)
显示原文
LVGL has a built-in trace system to track and record the timestamps of important events that occur during runtime, such as rendering events and user input events. These event timestamps serve as important metrics for performance analysis.
The trace system has a configurable record buffer that stores the names of event functions and their timestamps. When the buffer is full, the trace system prints the log information through the provided user interface.
The output trace logs are formatted according to Android's systrace format and can be visualized using Perfetto.
LVGL具有内置的跟踪系统,用于跟踪和记录运行时发生的重要事件的时间戳,例如渲染事件和用户输入事件。这些事件时间戳对于性能分析是重要的度量标准。
跟踪系统具有可配置的记录缓冲区,用于存储事件函数的名称和它们的时间戳。当缓冲区已满时,跟踪系统通过提供的用户界面打印日志信息。
Usage(用法)
Configure profiler(配置性能分析器)
显示原文
To enable the profiler, set LV_USE_PROFILER in lv_conf.h and configure the following options:
Enable the built-in profiler functionality by setting
LV_USE_PROFILER_BUILTIN.Buffer configuration: Set the value of
LV_PROFILER_BUILTIN_BUF_SIZEto configure the buffer size. A larger buffer can store more trace event information, reducing interference with rendering. However, it also results in higher memory consumption.Timestamp configuration: LVGL uses the
lv_tick_get()function with a precision of 1ms by default to obtain timestamps when events occur. Therefore, it cannot accurately measure intervals below 1ms. If your system environment can provide higher precision (e.g., 1us), you can configure the profiler as follows:
Recommended configuration in UNIX environments:
#include <sys/syscall.h>
#include <sys/types.h>
#include <time.h>

static uint32_t my_get_tick_us_cb(void)
{
    struct timespec ts;
    clock_gettime(CLOCK_MONOTONIC, &ts);
    return ts.tv_sec * 1000000 + ts.tv_nsec / 1000;
}

static int my_get_tid_cb(void)
{
    return (int)syscall(SYS_gettid);
}

static int my_get_cpu_cb(void)
{
    int cpu_id = 0;
    syscall(SYS_getcpu, &cpu_id, NULL);
    return cpu_id;
}

void my_profiler_init(void)
{
    lv_profiler_builtin_config_t config;
    lv_profiler_builtin_config_init(&config);
    config.tick_per_sec = 1000000; /* One second is equal to 1000000 microseconds */
    config.tick_get_cb = my_get_tick_us_cb;
    config.tid_get_cb = my_get_tid_cb;
    config.cpu_get_cb = my_get_cpu_cb;
    lv_profiler_builtin_init(&config);
}
Recommended configuration in Arduino environments:
void my_profiler_init(void)
{
    lv_profiler_builtin_config_t config;
    lv_profiler_builtin_config_init(&config);
    config.tick_per_sec = 1000000; /* One second is equal to 1000000 microseconds */
    config.tick_get_cb = micros; /* Use the microsecond time stamp provided by Arduino */
    lv_profiler_builtin_init(&config);
}
Log output configuration: LVGL uses the
LV_LOG()interface by default to output trace information. If you want to use another interface to output log information (e.g., file stream), you can redirect the log output using the following code:static void my_log_print_cb(const char * buf) { printf("%s", buf); } void my_profiler_init(void) { lv_profiler_builtin_config_t config; lv_profiler_builtin_config_init(&config); ... /* other configurations */ config.flush_cb = my_log_print_cb; lv_profiler_builtin_init(&config); }
要启用性能分析器,请在 lv_conf.h 中设置 LV_USE_PROFILER,并配置以下选项:
通过设置
LV_USE_PROFILER_BUILTIN来启用内置的性能分析器功能。缓冲区配置:将
LV_PROFILER_BUILTIN_BUF_SIZE的值设置为配置缓冲区大小。较大的缓冲区可以存储更多的跟踪事件信息,减少对渲染的干扰。但这也会导致更高的内存消耗。时间戳配置:LVGL默认使用精度为1毫秒的
lv_tick_get()函数获取事件发生时的时间戳。因此,它无法准确测量低于1毫秒的间隔。如果您的系统环境可以提供更高的精度(例如1微秒),则可以按以下方式配置性能分析器:
UNIX 环境推荐配置:
#include <sys/syscall.h>
#include <sys/types.h>
#include <time.h>

static uint32_t my_get_tick_us_cb(void)
{
    struct timespec ts;
    clock_gettime(CLOCK_MONOTONIC, &ts);
    return ts.tv_sec * 1000000 + ts.tv_nsec / 1000;
}

static int my_get_tid_cb(void)
{
    return (int)syscall(SYS_gettid);
}

static int my_get_cpu_cb(void)
{
    int cpu_id = 0;
    syscall(SYS_getcpu, &cpu_id, NULL);
    return cpu_id;
}

void my_profiler_init(void)
{
    lv_profiler_builtin_config_t config;
    lv_profiler_builtin_config_init(&config);
    config.tick_per_sec = 1000000; /* 一秒等于1000000微秒 */
    config.tick_get_cb = my_get_tick_us_cb;
    config.tid_get_cb = my_get_tid_cb;
    config.cpu_get_cb = my_get_cpu_cb;
    lv_profiler_builtin_init(&config);
}
Arduino 环境推荐配置:
void my_profiler_init(void)
{
    lv_profiler_builtin_config_t config;
    lv_profiler_builtin_config_init(&config);
    config.tick_per_sec = 1000000; /* 一秒等于1000000微秒 */
    config.tick_get_cb = micros; /* 使用Arduino提供的微秒级时间戳 */
    lv_profiler_builtin_init(&config);
}
日志输出配置:LVGL默认使用
LV_LOG()接口输出跟踪信息。如果您想使用另一个接口输出日志信息(例如文件流),可以使用以下代码重定向日志输出:static void my_log_print_cb(const char * buf) { printf("%s", buf); } void my_profiler_init(void) { lv_profiler_builtin_config_t config; lv_profiler_builtin_config_init(&config); ... /* 其他配置 */ config.flush_cb = my_log_print_cb; lv_profiler_builtin_init(&config); }
Run the test scenario(运行测试场景)
显示原文
Run the UI scenario that you want to measure, such as scrolling a scrollable page up and down or entering/exiting an application.
运行您想要测量的UI场景,比如滚动可滚动页面或进入/退出应用程序。
Process the logs(处理日志)
显示原文
Save the output log as my_trace.txt, use trace_filter.py for filtering and preprocessing:
./lvgl/scripts/trace_filter.py my_trace.txtor
python3 ./lvgl/scripts/trace_filter.py my_trace.txt
You will obtain a processed text file named trace.systrace, which roughly contains the following content:
# tracer: nop
#
LVGL-1 [0] 2892.002993: tracing_mark_write: B|1|lv_timer_handler
LVGL-1 [0] 2892.002993: tracing_mark_write: B|1|_lv_display_refr_timer
LVGL-1 [0] 2892.003459: tracing_mark_write: B|1|refr_invalid_areas
LVGL-1 [0] 2892.003461: tracing_mark_write: B|1|lv_draw_rect
LVGL-1 [0] 2892.003550: tracing_mark_write: E|1|lv_draw_rect
LVGL-1 [0] 2892.003552: tracing_mark_write: B|1|lv_draw_rect
LVGL-1 [0] 2892.003556: tracing_mark_write: E|1|lv_draw_rect
LVGL-1 [0] 2892.003560: tracing_mark_write: B|1|lv_draw_rect
LVGL-1 [0] 2892.003573: tracing_mark_write: E|1|lv_draw_rect
...
Import the processed trace.systrace file into Perfetto and wait for it to be parsed.
请将输出日志保存为 my_trace.txt,使用 trace_filter.py 进行过滤和预处理:
./lvgl/scripts/trace_filter.py my_trace.txt
- 或者
python3 ./lvgl/scripts/trace_filter.py my_trace.txt
您将获得一个名为 trace.systrace 的处理过的文本文件,大致包含以下内容:
# tracer: nop
#
LVGL-1 [0] 2892.002993: tracing_mark_write: B|1|lv_timer_handler
LVGL-1 [0] 2892.002993: tracing_mark_write: B|1|_lv_disp_refr_timer
LVGL-1 [0] 2892.003459: tracing_mark_write: B|1|refr_invalid_areas
LVGL-1 [0] 2892.003461: tracing_mark_write: B|1|lv_draw_rect
LVGL-1 [0] 2892.003550: tracing_mark_write: E|1|lv_draw_rect
LVGL-1 [0] 2892.003552: tracing_mark_write: B|1|lv_draw_rect
LVGL-1 [0] 2892.003556: tracing_mark_write: E|1|lv_draw_rect
LVGL-1 [0] 2892.003560: tracing_mark_write: B|1|lv_draw_rect
LVGL-1 [0] 2892.003573: tracing_mark_write: E|1|lv_draw_rect
...
将处理后的 trace.systrace 文件导入 Perfetto 并等待解析。
Performance analysis(性能分析)
显示原文
If the log parsing is successful, you will see the following screen:
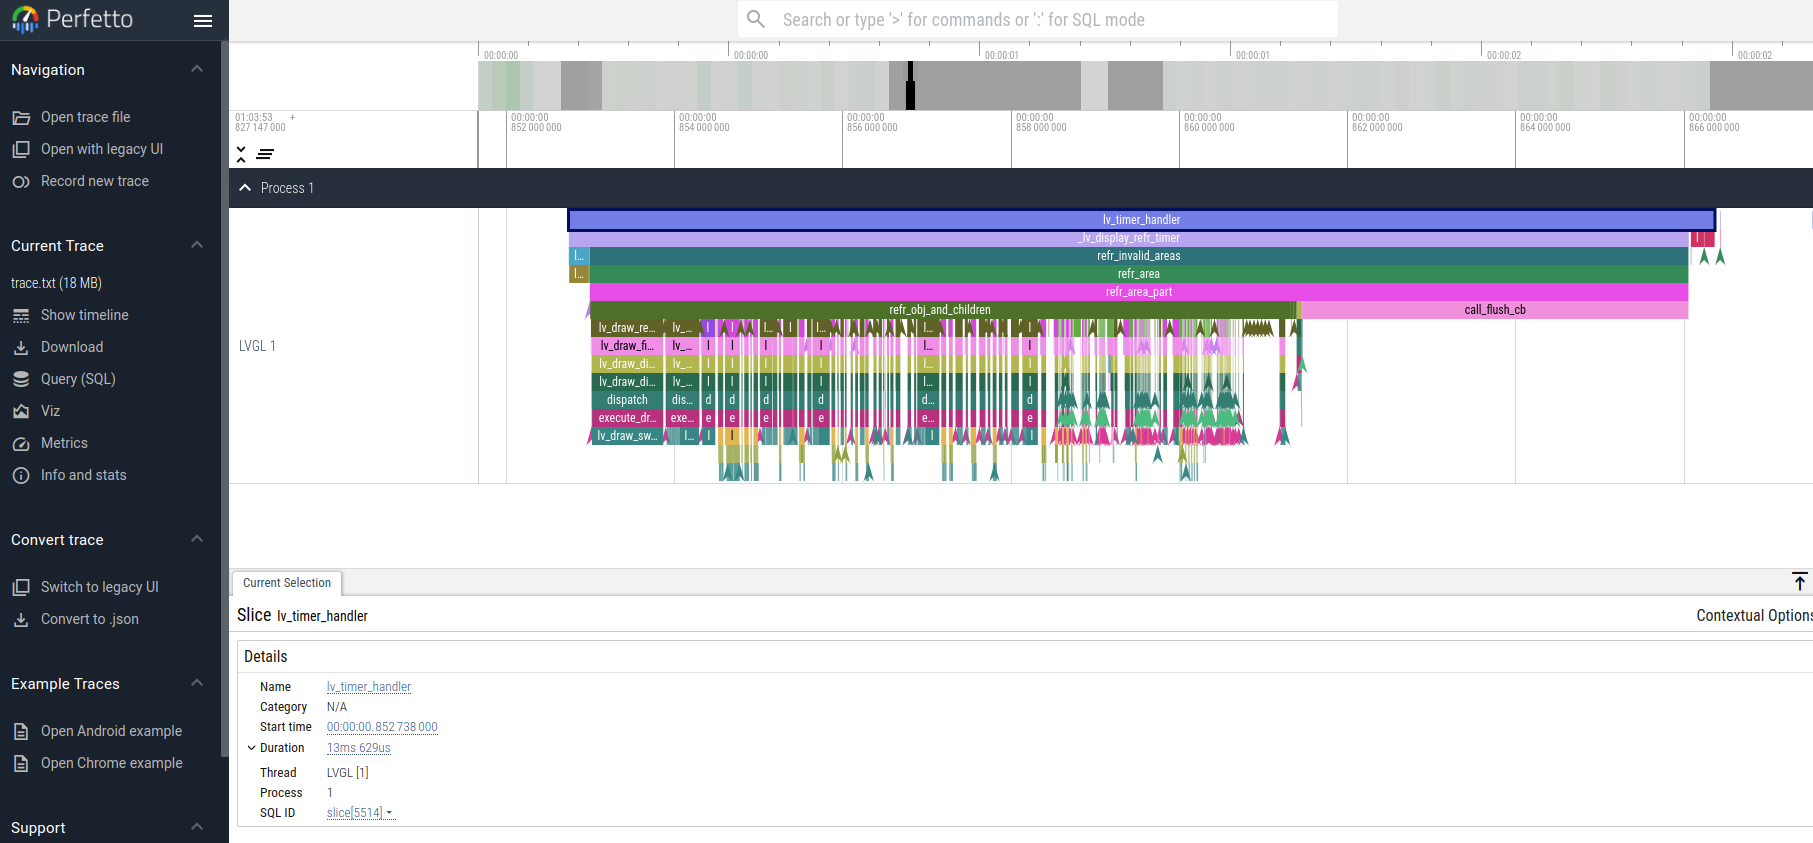
In the Perfetto UI, use the A or D keys to pan the timeline horizontally and the W or S keys to zoom in or out on the timeline. Use the mouse to move the focus and click on functions on the timeline to observe their execution time.
如果日志解析成功,你将会看到下面的屏幕:
在 Perfetto UI 中,使用 A 或 D 键来水平移动时间轴, 使用 W 或 S 键来放大或缩小时间轴。 使用鼠标移动焦点,并点击时间轴上的函数来观察它们的执行时间。
Add Measurement Point(添加测量点)
显示原文
Users can add their own measured functions:
void my_function_1(void)
{
    LV_PROFILER_BEGIN;
    do_something();
    LV_PROFILER_END;
}

void my_function_2(void)
{
    LV_PROFILER_BEGIN_TAG("do_something_1");
    do_something_1();
    LV_PROFILER_END_TAG("do_something_1");

    LV_PROFILER_BEGIN_TAG("do_something_2");
    do_something_2();
    LV_PROFILER_END_TAG("do_something_2");
}
用户可以添加自己的测量函数:
void my_function_1(void)
{
    LV_PROFILER_BEGIN;
    do_something();
    LV_PROFILER_END;
}

void my_function_2(void)
{
    LV_PROFILER_BEGIN_TAG("do_something_1");
    do_something_1();
    LV_PROFILER_END_TAG("do_something_1");

    LV_PROFILER_BEGIN_TAG("do_something_2");
    do_something_2();
    LV_PROFILER_END_TAG("do_something_2");
}
Custom profiler implementation(自定义分析器实现)
显示原文
If you wish to use a profiler method provided by your operating system, you can modify the following configurations in lv_conf.h:
LV_PROFILER_INCLUDE: Provides a header file for the profiler function.LV_PROFILER_BEGIN: Profiler start point function.LV_PROFILER_END: Profiler end point function.LV_PROFILER_BEGIN_TAG: Profiler start point function with custom tag.LV_PROFILER_END_TAG: Profiler end point function with custom tag.
Taking NuttX RTOS as an example:
#define LV_PROFILER_INCLUDE "nuttx/sched_note.h"
#define LV_PROFILER_BEGIN          sched_note_begin(NOTE_TAG_ALWAYS)
#define LV_PROFILER_END            sched_note_end(NOTE_TAG_ALWAYS)
#define LV_PROFILER_BEGIN_TAG(str) sched_note_beginex(NOTE_TAG_ALWAYS, str)
#define LV_PROFILER_END_TAG(str)   sched_note_endex(NOTE_TAG_ALWAYS, str)
如果您想使用操作系统提供的分析器方法,您可以在 lv_conf.h 中修改以下配置:
LV_PROFILER_INCLUDE:为分析器函数提供头文件。LV_PROFILER_BEGIN:分析器开始点函数。LV_PROFILER_END:分析器结束点函数。LV_PROFILER_BEGIN_TAG:带有自定义标签的分析器开始点函数。LV_PROFILER_END_TAG:带有自定义标签的分析器结束点函数。
以 NuttX RTOS 为例:
#define LV_PROFILER_INCLUDE "nuttx/sched_note.h"
#define LV_PROFILER_BEGIN          sched_note_begin(NOTE_TAG_ALWAYS)
#define LV_PROFILER_END            sched_note_end(NOTE_TAG_ALWAYS)
#define LV_PROFILER_BEGIN_TAG(str) sched_note_beginex(NOTE_TAG_ALWAYS, str)
#define LV_PROFILER_END_TAG(str)   sched_note_endex(NOTE_TAG_ALWAYS, str)
FAQ(常见问题解答)
Perfetto log parsing fails(完美的日志解析失败)
显示原文
Please check the completeness of the logs. If the logs are incomplete, it may be due to the following reasons:
Serial port reception errors caused by a high baud rate. You need to reduce the baud rate.
Data corruption caused by other thread logs inserted during the printing of trace logs. You need to disable the log output of other threads or refer to the configuration above to use a separate log output interface.
Make sure that the string passed in by
LV_PROFILER_BEGIN_TAG/END_TAGis not a local variable on the stack or a string in shared memory, because currently only the string address is recorded and the content is not copied.
请检查日志的完整性。如果日志不完整,可能是由于以下原因:
由于波特率过高引起的串口接收错误。您需要降低波特率。
在打印跟踪日志期间插入了其他线程日志导致的数据损坏。您需要禁用其他线程的日志输出,或者参考上面的配置使用单独的日志输出接口。
确保通过
LV_PROFILER_BEGIN_TAG/END_TAG传递的字符串不是堆栈上的局部变量或者共享内存中的字符串,因为当前仅记录字符串地址,而不复制内容。
Function execution time displayed as 0s in Perfetto(功能执行时间显示为0秒在Perfetto中)
显示原文
If the function execution time is lower than the precision of the timestamps, this situation can occur. You can refer to the configuration instructions above to use a higher precision timestamp.
如果函数执行时间低于时间戳的精度,就会出现这种情况。您可以参考上面的配置指南来使用更高精度的时间戳。
Significant stuttering occurs during profiling(在进行分析过程中出现了明显的卡顿。)
显示原文
When the buffer used to store trace events becomes full, the profiler will output all the data in the buffer, which can cause UI blocking and stuttering during the output. You can optimize this by taking the following measures:
Increase the value of
LV_PROFILER_BUILTIN_BUF_SIZE. A larger buffer can reduce the frequency of log printing, but it also consumes more memory.Optimize the execution time of log printing functions, such as increasing the serial port baud rate or improving file writing speed.
当用于存储跟踪事件的缓冲区变满时,分析器会输出缓冲区中的所有数据,这可能会导致 UI 的阻塞和输出过程的卡顿。您可以通过采取以下措施来进行优化:
增加
LV_PROFILER_BUILTIN_BUF_SIZE的值。较大的缓冲区可以减少日志输出的频率,但也会消耗更多的内存。优化日志输出函数的执行时间,例如增加串口波特率或改善文件写入速度。
Trace logs are not being output(未输出追踪日志)
显示原文
If the trace logs are not automatically printed when the buffer is not full, you can try the following methods to force the log output:
Reduce the value of
LV_PROFILER_BUILTIN_BUF_SIZEto fill the buffer more quickly and trigger automatic printing.Manually call or use a timer to call the
lv_profiler_builtin_flush()function to force the log output.
如果缓冲区未满时未自动打印跟踪日志,您可以尝试以下方法来强制日志输出:
减小
LV_PROFILER_BUILTIN_BUF_SIZE的值,以更快地填充缓冲区并触发自动打印。手动调用或使用定时器调用
lv_profiler_builtin_flush()函数来强制日志输出。